Home / Blogs
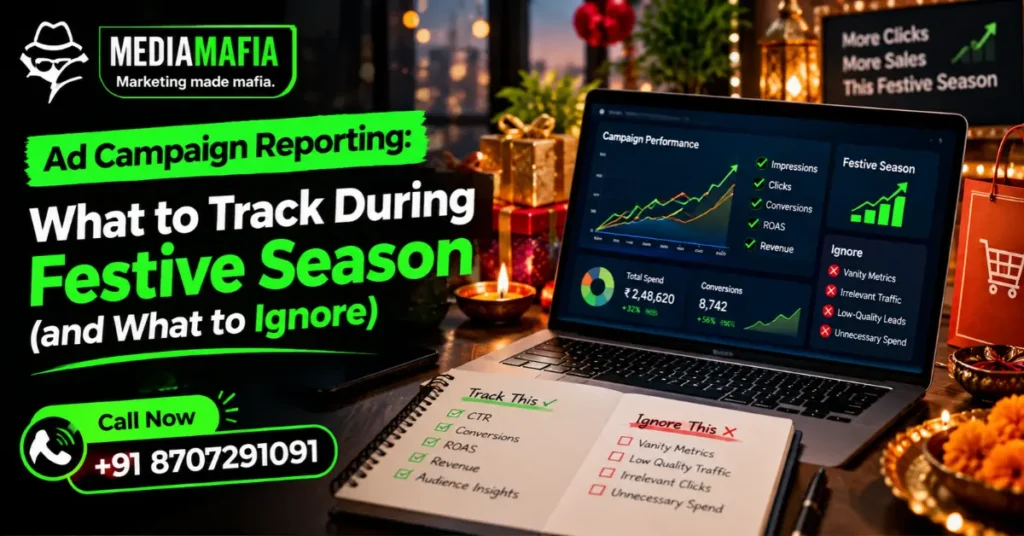
Ad campaign reporting is where honest agencies and hopeful agencies separate. A report that says “reach increased, impressions grew, engagement was strong” tells you nothing about whether your shop got customers. A report that says “we spent this much, received this many genuine enquiries, and here is what we are changing next week” tells you everything.
In our experience running festive campaigns for local businesses, owners rarely complain about the numbers themselves. They complain that nobody told them what the numbers meant. This guide shows what to track, how to read it and how to build a one-page weekly report you can understand in five minutes.
Quick answer: Good ad campaign reporting tracks spend, genuine enquiries, cost per enquiry, enquiry-to-sale rate and revenue where possible, broken down by platform and creative. It ends each week with decisions: what to scale, what to pause and what to test next. Vanity numbers like impressions and likes belong at the bottom, not the top.
Festive campaigns move fast. Budgets rise, competitors multiply and customer interest peaks for a few weeks. Mistakes that cost little in a quiet month cost a lot in October.
Reporting helps in three ways. It shows where money works and where it leaks. It supports quick decisions while the window is still open. And it gives you proof for next year, so you do not start from zero.
However, reporting only helps when the data is honest. Festival traffic can make everything look successful, so a careful report separates real results from seasonal noise.
Platforms show dozens of numbers. Most of them describe activity, not results.
| Vanity metrics | Business metrics |
| Impressions and reach | Genuine enquiries (calls, WhatsApp chats, forms) |
| Likes and shares | Cost per genuine enquiry |
| Followers gained | Enquiry-to-sale rate |
| Click-through rate alone | Cost per sale and revenue |
| Video views | Store visits or bookings traced to ads |
Vanity metrics are not useless. They help diagnose problems, for example when a low click-through rate suggests a weak hook. But they should never be the headline of your report.
We keep festive reports focused on nine numbers.
The last one surprises people. Response time belongs in a marketing report because slow replies destroy results that ads paid for.
Reports are only as good as the data behind them. Set up tracking before the campaign starts.
Install the Google tag and set up conversion actions for calls, form submissions and WhatsApp clicks. On Meta, install the Pixel and, where possible, the Conversions API. The platforms then optimise toward the actions you define, and they report those actions back to you.
For setup details, read Google Ads Help and the Meta Business Help Centre.
UTM parameters are short tags added to your ad links. They tell Google Analytics which platform, campaign and creative sent each visitor. Use a consistent naming pattern, such as source, medium, campaign and content, so your reports stay tidy. Google Analytics Help explains how they work.
Calls and WhatsApp chats do not always show up in dashboards. Ask your team to record every enquiry in a simple sheet with the date, source, product, outcome and sale value. It takes seconds per entry and gives you the most honest dataset you will have.
Your landing page should record every click on the WhatsApp button, call button and form. Our festive landing page checklist shows how to set that up.
A useful report fits on one page. Use this structure.
If your agency sends a forty-page deck full of charts and no decisions, ask for this format instead.
Festival season makes numbers deceptive. Here is how to stay honest.
Compare like with like. Compare this week with the same week last year, or with the previous week of the same campaign. Comparing Dhanteras week with a quiet July tells you only that festivals are busy.
Separate paid from organic. Some enquiries would have come anyway, because festival demand lifts everyone. Check how many enquiries arrive on days when you pause spend, if you can afford the test.
Watch for lag. A customer may click an ad on Monday and buy on Saturday. Look at results over a window, not just same-day numbers.
Check lead quality. A low cost per lead means little when most leads are curious browsers. Count only genuine enquiries, and ask your team to mark spam and low-quality contacts.
Do not trust a single number. Cost per enquiry, enquiry-to-sale rate and revenue together tell the story. One number alone can mislead.
A customer might see your Instagram Reel, search your name on Google, check your reviews and then walk in. Which platform gets credit?
No tool answers this perfectly. Platforms often claim credit for the same customer, so adding their reported numbers can overcount. That is why your own enquiry log matters. When a customer walks in, ask “How did you hear about us?” and record the answer.
In practice, use platform data for optimisation and your own log for a sanity check. When the two disagree sharply, investigate before you trust either.
A report earns its value when it changes what you do. Use these rules of thumb.
When Diwali ends, resist the urge to switch everything off and forget it. A post-festival review turns one season into a permanent advantage.
Record these points while they are fresh:
Save the review in one document. Next year, you will begin with evidence and not memory. This also feeds your broader planning for the winter wedding season and the new year.
Watch for these signs.
Our festive ads packages guide includes reporting in its scorecard, and our performance marketing services page explains how we set up reports for clients.
It is the regular summary of how paid campaigns performed, covering spend, enquiries, cost per enquiry, sales and the decisions taken as a result.
Weekly during festive campaigns, with a short monthly summary and a full review after the season. Fast-moving campaigns need frequent checks.
Cost per genuine enquiry matters most early on, and cost per sale or return on ad spend matters most once you can trace sales.
Yes. Use conversion tracking on click-to-chat and call buttons, UTM links on ads and a simple enquiry log kept by your team.
Platforms measure only what they can see, and they may claim credit for the same customer. Compare their numbers with your own enquiry log and customer feedback.
Good ad campaign reporting is short, honest and decision-focused. Track the nine metrics, capture data from tracking and your own log, read festive spikes carefully and end every week with clear actions.
To get a reporting system built around your business, contact our team, or see how we work as a best digital marketing agency in Varanasi.